At the 2018 Android Dev Summit, Google discussed how the choice of colors in Android applications directly affect battery life. This confirmed the obvious — Dark Mode can significantly help reduce the battery drain on devices with OLED screens. The rationale is that pixels are completely turned off, unlike LCD screens where power is required to display both light and dark shades of a pixel. Additionally, users are also asking for platform support for usability and ergonomic reasons: Dark Mode is easier on the eyes, especially at night!
While Dark Mode may help reduce battery drain attributed to the display, the exact energy savings are highly dependent on the display content. Despite the surge of many popular apps adding support for Dark Mode this past year (Google Maps, Gboard, FB Messenger and YouTube to name a few), it remains unclear how much battery Dark Mode will actually save. Answering this question is crucial to help app designers make informed design decisions and to justify the development effort of implementing Dark Mode. The end goal ultimately being to increase mobile revenue from prolonged user engagement due to battery savings.
We set out to answer this question definitively. Our automated battery drain testing solution, Eagle Tester now supports precise energy profiling of OLED displays! You can now accurately find out how much power drain is attributed to the display versus other power-hungry phone components such as CPU, GPU, and Network. We find ourselves in a unique position to carry out (with relative ease) a case study to measure and quantify the battery savings of Dark Mode on a handful of popular Google apps.
Challenges of accurate OLED power modeling and energy profiling
Accurate power modeling of OLED displays on modern smartphones is challenging as the power draw of subpixel is not additive! A pixel consists of three subpixels (Red, Green, and Blue).
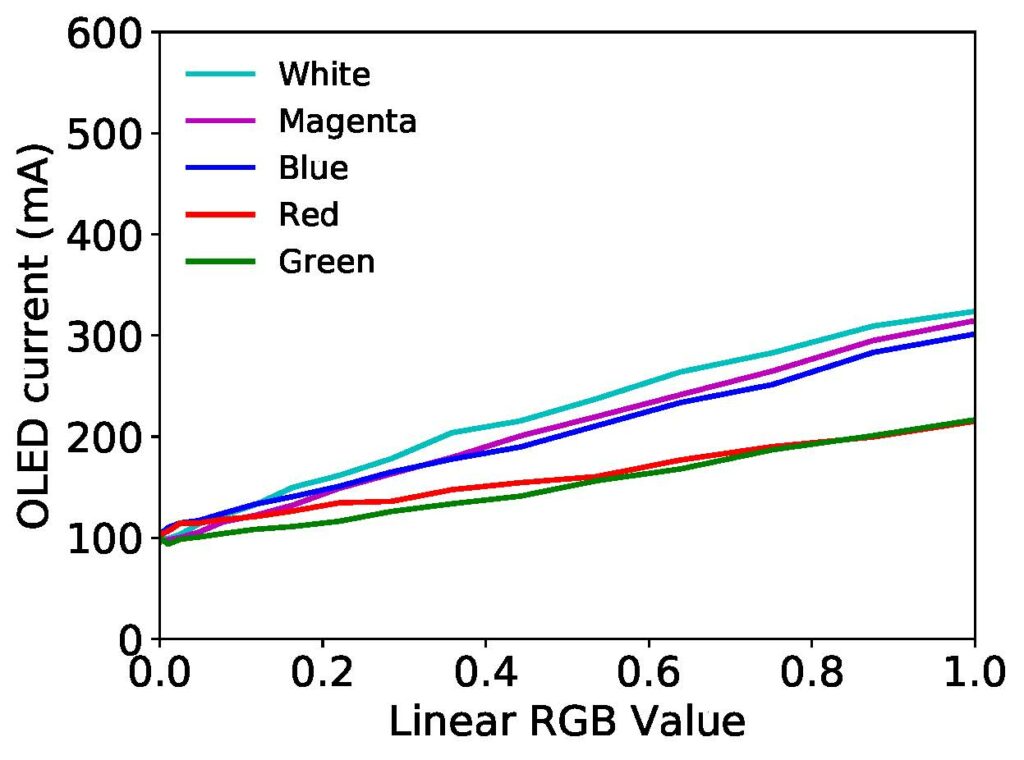
Figure 1 shows the OLED display power draw on a Nexus 6 device. Using a Monsoon power monitor we measured the power used by the display while showing a series of monochrome images; Red, Green, Blue, Magenta (Red+Blue) and White (Red+Green+Blue). What we observe is that the power draw for Blue is very close to those of Magenta and White and as a result, the power draw for Magenta is much less than the sum of Red and Blue. For example, at linear RGB value of 1.0 (sRGB of 255), the power draw for Red, Green, Blue, Magenta and White are 216, 217, 302, 315 and 324 mA respectively. Taking out the 100mA base OLED power (power for displaying a dark screen), the Red, Green and Blue sub pixels account for 116mA, 117mA and 202mA. If we incorrectly were to assume that the sub pixel power draw is additive, the power for Magenta would have been 116 (Red) + 202 (Blue) + 100 (base) = 418 mA and for White 116 (Red) + 117 (Green) + 202 (Blue) + 100 (base) = 535 mA. These additive computed values are 33% and 65% higher than the measured OLED power for displaying the Magenta (315 mA) and White (324 mA) images respectively.
The above non-additive behavior of OLED displays has been observed on several Android devices we have tested (Moto Z3, Pixel 2 and Nexus 6). It suggests that a simple OLED power model based on the color histogram of base color sub pixels and superposition is unlikely to model the OLED power draw accurately! For example, such a model would over-predict the OLED power draw for Magenta by 33% and for White by 65%.
Mobile Enerlytics has developed a proprietary OLED power modeling technique that accurately captures the non-additive power draw behavior of OLED displays. With our Monsoon power monitor, we measured the power draw of displaying a set of 100 diverse images (on a handful of Android devices we had on hand) and validated the accuracy of our OLED power modeling technique to be within a 3.3% average error when compared to the power meter readings!
Apps and Dark Mode testing scenarios
The aggregated user-perceived impact of battery savings is the most for popular apps, so we picked a number of pre-installed Android apps, each having 1 Billion or more downloads. For each app, we decided on 1 or 2 typical usage scenarios where users are likely to spend a significant amount of time on the screen so that the tests can reflect typical battery savings of Dark Mode. Table 1 summarizes the list of apps along with the scenarios, test durations, total phone energy savings and the OLED energy savings attributed to Dark Mode.
Table 1. List of apps tested, usage scenarios, total phone energy savings and OLED energy savings from Dark Mode.
| App | Usage scenario | Test duration | Total energy savings* | OLED energy savings in Dark Mode* | Percentage of total energy drained by OLED in Light Mode* |
| Chrome (75.0) | Load and scroll a webpage that supports dark mode | 35s | 3.8% | 21.6% | 32.2% |
| Google Calendar (6.0) | Navigating, creating and browsing scheduled events | 45s | 14.7% | 30.5% | 54.9% |
| Google News (5.12) | Browsing, reading news that supports dark mode (The Verge) | 1m45s | 23.5% | 36.9% | 68.5% |
| YouTube (14.25) | Browsing | 35s | 16.7% | 33.2% | 52.6% |
| YouTube (14.31) | Search, video playback in full screen (landscape mode) | 1m | 1.8% | 7.4% | 30.6% |
| YouTube (14.31) | Search, video playback (portrait mode) | 1m | 6.5% | 23.9% | 36.0% |
* The reported energy savings are computed with 95% confidence level. i.e., 0.95 probability that the ratio is at least the reported number.
Testing methodology
Our testing methodology is as follows:
1. Author UI Automator tests for each usage scenario.
2. Use Eagle Tester to capture the energy profile while the UI Automator test is running.
3. Repeat each usage scenario 5 times for Light Mode and 5 times for Dark Mode, clearing the cache and saved history between each test iteration.
4. Examine the energy profile captured by Eagle Tester in the Mobile Enerlytics dashboard.
All tests are run on a Nexus 6 phone connected to a stable WiFi connection in an indoor environment. Since the OLED hardware display power draw depends upon the display contents and screen brightness, we use the same screen brightness across all tests. We used 38% screen brightness; the brightness was picked by Android’s adaptive screen brightness in our indoor environment.
Dark Mode cuts total battery drain by 1.8% to 23.5%
Figure 2 shows the total phone energy savings of the 6 usage scenarios at 38% screen brightness level. Indeed we see that Dark Mode can lead to significant energy savings! Note that the battery drain energy savings vary widely from app to app, ranging from 1.8% for searching and playing a video full screen on YouTube to 23.5% energy savings for reading news articles in the Google News app.
Why do total energy savings vary by so much?
Assuming all other app behavior does not change, the total energy saving of Dark Mode equals the OLED display energy savings of Dark Mode multiplied by the portion of OLED energy as a percentage of the total app energy in Light Mode:
Assuming all other components drain the same energy, we get:
\(E_{light}^{Screen} – E_{dark}^{Screen} \approx E_{light}^{Total} – E_{dark}^{Total}\)
where \(E_{light}^{Screen}, E_{dark}^{Screen}, E_{light}^{Total}, E_{dark}^{Total}\) are screen energy in light mode, screen energy in dark mode, total energy in light mode and total energy in dark mode respectively. Thus,
Total energy savings = \( 1 – \frac{E_{dark}^{Total}}{E_{light}^{Total}}\)
\(= \frac{E_{light}^{Total} – E_{dark}^{Total}}{E_{light}^{Total}}\)
\(\approx \frac{E_{light}^{Screen} – E_{dark}^{Screen}}{E_{light}^{Total}}\)
\(\approx \frac{E_{light}^{Screen}}{E_{light}^{Total}} (1 – \frac{E_{dark}^{Screen}}{E_{light}^{Screen}})\)
Total energy savings \(\approx\) Ratio of screen energy to total energy in light mode * Dark mode screen energy savings
The impact of OLED energy portion
One of the reasons that the total energy savings differ among the apps is due to their varying portion of OLED display power. These variations are conveniently captured and exposed by Eagle Tester’s capability to profile and account for app battery drain by all major phone components such as CPU, GPU, Network and Display. For example, the far right column in Table 1 shows that Google News OLED display energy in Light Mode accounts for 68.5% of the total energy drain. This suggests that any energy saving due to the OLED display will make a big difference to the total app energy drain. Indeed we see that the 36.9% OLED energy saving in Dark Mode translates into 23.5% total app energy saving! In contrast, YouTube portrait mode OLED display energy in Light Mode accounts only for 36.0% of the total app energy drain. As a result, 23.9% of OLED display energy saving in Dark Mode translates into only 6.5% total app energy saving!
The impact of dynamic content
Another reason why Dark Mode energy savings vary among the apps is due to the portion of the dynamic content on screen. For example, we found that comparing the YouTube video playback scenario in portrait mode with video playback in landscape mode (full screen), the display power savings are reduced from 23.9% to 7.4%. As a rule of thumb, the more dynamic content you have on the screen the less OLED energy savings you will benefit from.
The Mobile Enerlytics dashboard video synchronized power timeline further allows us to find exact moments during the test where the OLED screen power demands are high. We find that in the youtube video when the screen has more white colors the power demand on the screen spikes!
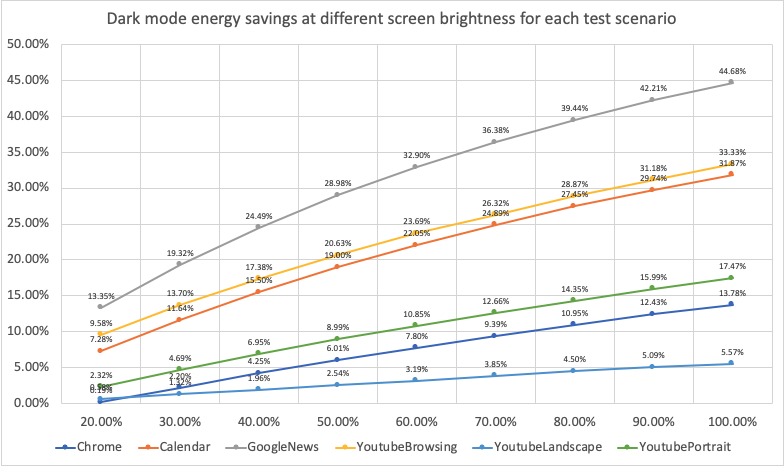
The impact of brightness
Eagle Tester’s accurate OLED power model allows us to perform what-if analysis to answer how the display brightness setting affects the OLED power draw in each of the testing scenarios without the need to repeat the tests. Figure 3 shows the total app energy-saving decreases with screen brightness for the 6 app testing scenarios. We see that the impact of the brightness varies with the apps: when changing the brightness from 60% to 20%, the total app energy savings go from 23.7% to 9.6% for Calendar and from 7.8% to only 0.2% for Google Chrome. This is because the screen consumes a smaller percentage of total energy in Google Chrome compared to Calendar as shown in Table 1.
Conclusion
Our case study has the following takeaways:
Dark Mode can indeed reduce the display power draw by up to 58.5% at full brightness for the set of popular Android apps that we tested! In terms of whole phone battery drain reduction, that translates into 5.6% to 44.7% savings at full brightness and 1.8% to 23.5% savings at 38% brightness.
It takes only minutes to quantify the energy savings of Dark Mode for any given app using Eagle Tester!
If you haven’t added Dark Mode to your app yet, consider doing so today! If you are looking to quantify the OLED display energy savings of Dark Mode in your app, reach out to us. We can help!
What do you think about the power saving implications of Dark Mode? Let us know in the comments below!
One thought on “What is the impact of Dark Mode on battery drain?”
Comments are closed.
I have Samsung m20. If I keep my phone in dark mode will it consume less battery