In Part I of our blog series on Essentials of Battery Drain Testing, we introduced the power model-based battery drain testing methodology. We discussed how this methodology overcomes limitations of conventional battery drain testing approaches based on battery level drop or expensive hardware power monitor readings. In particular, we discussed how power model-based battery drain testing is inexpensive, fast, can isolate power drawn by the app under test, and can provide actionable insights to help optimize the detected battery drain deviation from a baseline.
Model-based battery drain testing is not without its technical challenges. In particular, it needs to meet three essential requirements expected of any effective battery drain testing methodologies:
- Accuracy — ensuring high accuracy is important to establishing the baseline battery drain of an app;
- Repeatability — ensuring high repeatability is important to effectively detecting any deviation in battery drain between two test runs (e.g., of two releases of an app);
- Handset Compatibility — ensuring the above properties on diverse handsets is important so that developers can perform battery drain testing on diverse handset models used by billions of users.
In this blog, we take a deep dive in the first requirement — accuracy. We recap the model-based battery drain testing methodology. We then discuss technical challenges in making model-based energy profiling accurate. Finally, we quantify the accuracy of Eagle Tester against the built-in current sensor.
Model-based battery drain testing –Recap
The key technical components of model-based battery drain testing are two-fold:
- Power modeling — Derive accurate power models for every power-hungry phone component, e.g., CPU, GPU, Network (LTE, Wifi), GPS, OLED Screen, Media Decoder, and DRM Hardware.
- Power estimation — During an app test run, log system events that serve as power model triggers. In post-processing, estimate the instantaneous power draw of every phone component using the power triggers along with the power models.
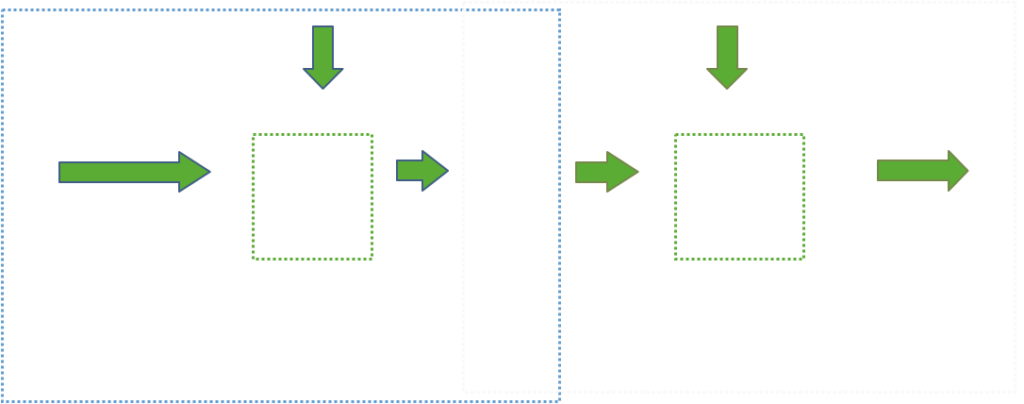
Figure 1 illustrates the two phases of model-based energy profiling: Power modeling and Power estimation.
A power model for each phone component captures the correlation between the component-usage triggers and the measured component power draw. In the model derivation phase, microbenchmarks and/or real apps are run on the phone to exercise one component at a time to induce the event power triggers. The triggers associated with each component are logged along with the instantaneous power measured using an external power monitor or the built-in power sensor available in most modern smartphones. Next, we isolate the power drawn by each phone component and derive the power model by extracting the correlation between the triggers and the component’s power draw.
Once a model is derived, it is used to estimate the power draw of that phone component during the runtime of any app. A power monitor or power sensor is no longer needed. This is done by collecting the triggers during the runtime of an app and then in post-processing applying the power model to the collected triggers to produce the estimated power draw.
The challenges of high accuracy energy profiling
Accurate energy profiling is an art of its own and has been intensively researched in academia in the past decade. We ourselves have contributed significant foundational knowledge to the literature and advanced the state-of-the-art of accurate energy profiling. Achieving high accuracy in the above energy profiling process faces three technical challenges:
1. What are the right power triggers for a phone component?
High accuracy power modeling would be a lot easier to achieve if every system event on the phone is logged. However, such an approach has a prohibitively high overhead which can impact the behavior of the app under test. Thus the challenge is in choosing the right triggers that are comprehensive, able to accurately capture power behavior and can be logged with minimal overhead (Figure 2).

2. How to isolate power consumption for a phone component?
For power modeling of a phone component, it is imperative to isolate the power consumed by that phone component. This is challenging because external power monitors and built-in current sensors can only measure the whole phone power. In a typical app test scenario, more than one phone component can be active at the same time making it challenging to isolate the power of an individual component.
3. What is the right power model for a phone component?
For high accuracy energy profiling, the power models for all phone components need to be highly accurate, as they are the building blocks for energy estimation. The challenge here is in identifying the power model that accurately captures the power behavior of each phone component. For many phone components, the intuitive approach of using the utilization to model power behavior is insufficient because those components can continue to consume high power for a period of time after being utilized.
Overcoming the design challenges for high accuracy battery drain testing
We at Mobile Enerlytics have developed effective solutions to the three design challenges mentioned above for achieving high accuracy in model-based battery drain testing.
We designed comprehensive microbenchmarks to thoroughly exercise each phone component to derive the power model for that component. For example, our LTE microbenchmarks perform basic socket operations. One benchmark simply opens a socket, waits for 10 seconds and then closes the socket. Another benchmark opens a socket, receives 40 KB of data, then closes the socket and so on. Our CPU microbenchmarks run busy loops in all CPU core frequency combinations.
In running each microbenchmark, we uninstall all unnecessary apps on the phone to minimize the interference of any potential background processes, and we capture the triggers and the phone power using a power meter.
Choosing the right power triggers
For the power trigger design, we systematically analyzed the accuracy-overhead tradeoffs for different trigger options for each phone component to arrive at the optimal trigger design.
For example, recording a low screen resolution video as the triggers to the OLED power model incurs much lower overhead but does not substantially reduce OLED Screen power estimation accuracy. This is because a low-resolution frame is effectively an extremely good sampling of the original high-resolution frame.
Isolating power consumption
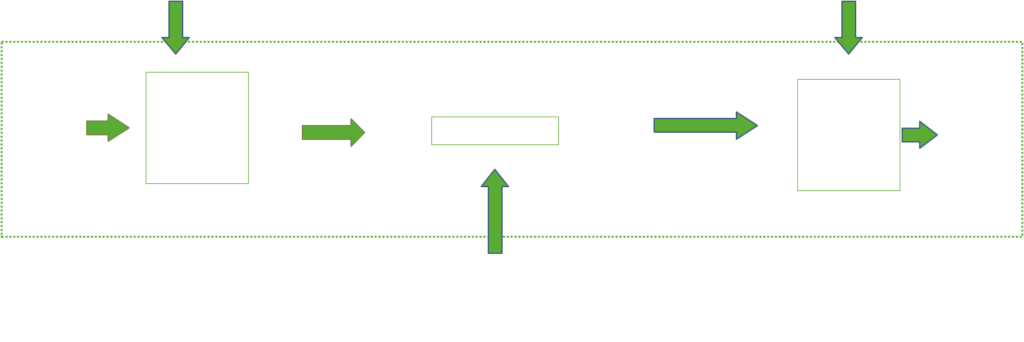
We derive the power models for the phone components incrementally. This allows us to isolate the power draw by the component being modeled by subtracting the power used by other phone components exercised in the same microbenchmark. Figure 3 shows an example of how we isolate LTE power consumption while modeling LTE. In running the network microbenchmarks, we gather CPU triggers, LTE triggers and the actual power consumption from a power meter. We then apply the CPU power model (that we previously derived) on CPU triggers to estimate the CPU power incurred in packet processing. Then we subtract the estimated CPU power from actual power consumption to obtain the isolated LTE power consumption.
Choosing the right power model
After isolating the power and capturing the right triggers for a phone component, we can derive the correlation between the triggers and power behavior into a power model for that component.
The state-of-the-art power models fall into two major categories.
1. The first category of power models known as utilization-based models is based on the intuitive assumption that the utilization of a phone component (e.g., CPU) corresponds to a certain power state. The change in utilization “triggers” the power state change of that component. Consequently, these models use the utilization of a phone component as the “trigger” in modeling power states and state transitions.
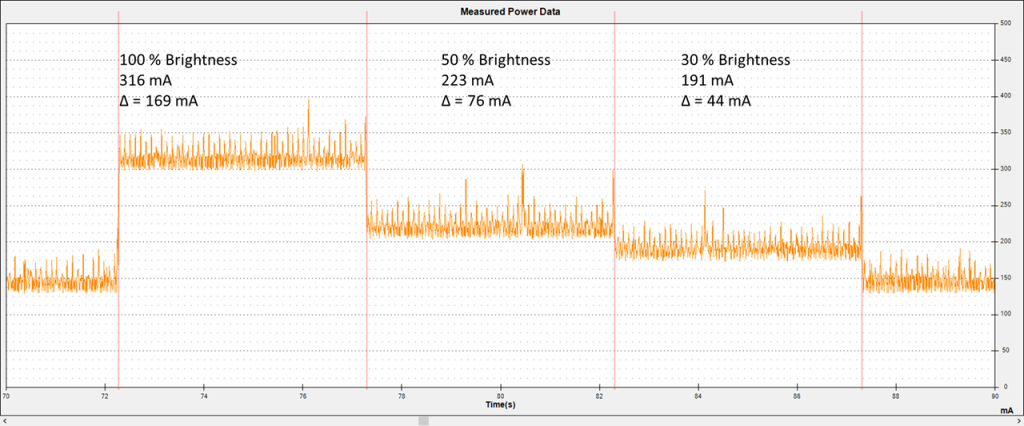
For example, Figure 4 shows that OLED power consumption drops as soon as the screen brightness is reduced. Hence, the screen brightness trigger can be modeled using a utilization-based power model.
2. The second category of power models captures phone component power behavior using finite state machines (FSMs). They capture the different power states and the transitions between them. Each power state is annotated with measured power draw and each state transitions with durations.
For example, Figure 5(a) shows LTE radio component power behavior when receiving 40KB of data. After the active data transfer, the LTE radio continues to stay in a so-called “tail” power state for up to 11 seconds without performing any useful work while waiting for another potential data transfer. Utilization-based models fail to capture such power behavior. This power behavior of the LTE Radio component is captured using an FSM power model as shown in Figure 5(b).
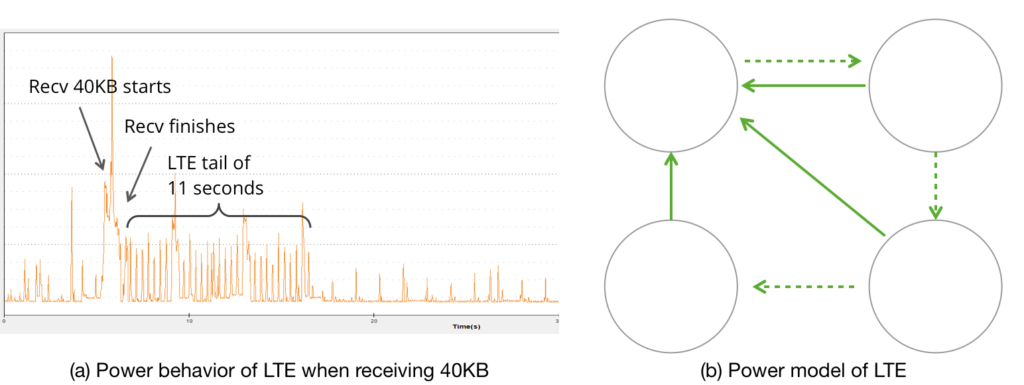
For selecting the right model type (utilization-based or FSM-based), we correlate the component triggers with the component’s power consumption observed from running the microbenchmarks.
Applying our methodology described above, we have developed highly accurate power models for all major modern smartphone components. These include multicore CPUs, GPU, SD Card, OLED display, WiFi Radio, LTE Radio, Camera, Media decoder hardware and DRM hardware. We have also developed a low-overhead logging mechanism of all the necessary triggers that suite our model designs. Integrating the two allowed us to build a state-of-the-art battery drain testing solution — Eagle Tester.
High accuracy battery drain testing with Eagle Tester
We demonstrate the accuracy of Eagle Tester using a case study on the impact of Dark Mode we wrote about in our previous blog post. To recap, we performed 6 test scenarios of 4 pre-installed Android apps on a Nexus 6 device. Using UI Automator, each test was run 5 times each in Light Mode and in the Dark mode, totaling 60 test runs.
Accuracy: End-to-end energy estimation error
We first evaluate the end-to-end energy error. We calculate the end-to-end energy estimation by integrating the power estimations of Eagle Tester over the duration of the test run. Similarly, we calculate the end-to-end energy ground truth by integrating the power ground truth obtained from the built-in current sensor readings.
Figure 6 shows the end-to-end error in energy estimation from Eagle Tester when compared to the built-in current sensor of a Nexus 6 device. We see that all 60 runs have less than 6.5% end-to-end energy error. In particular, 50% (or 30 runs) have absolute percentage error ranging from 0.14% to 1.64% visualized in the first bucket of the histogram. This shows that Eagle Tester accurately predicts energy for the 60 traces when compared to the ground truth energy measured by the built-in current sensor.

Accuracy: Instantaneous power estimation error
Next, we evaluate the instantaneous power error by comparing power estimations of Eagle Tester with the built-in device current sensor. Doing such a comparison on a sample-by-sample basis is unfortunately not fruitful since Eagle Tester’s power estimation has microsecond-level granularity (granularity of the logged triggers), whereas the built-in current sensor granularity is in the order of hundreds of milliseconds to seconds.
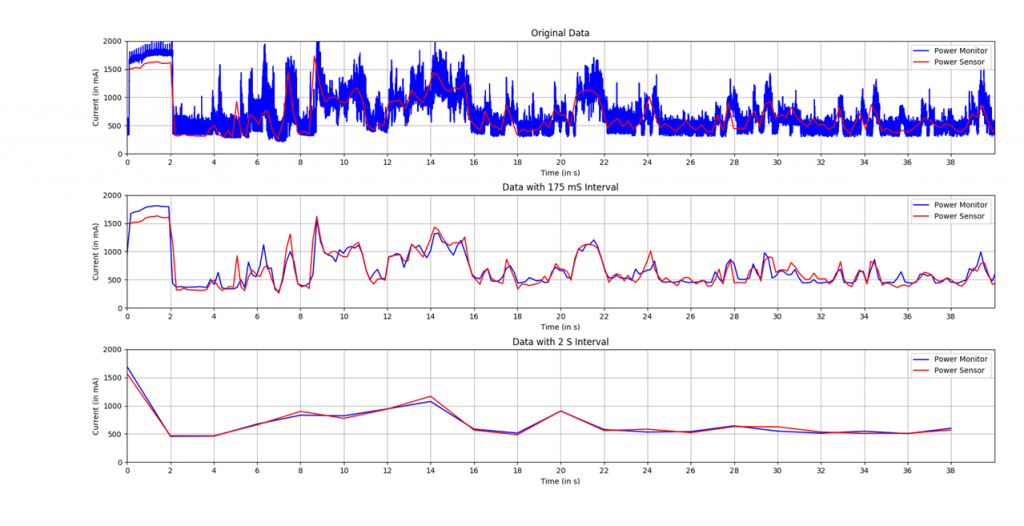
To see the limitation of power sensor readings, let us take Nexus 6 as an example. The updates of the current sensor hardware happen only every 175ms on Nexus 6. Thus a single power sensor reading may be quite off from the true average power draw in a sensor-reading interval of 175ms. To overcome this challenge, we measured the average of 2-second windows and found it to be almost identical to the average power draw from an external Monsoon power monitor which updates every 200 microseconds.
Figure 8 shows the Eagle Tester power timeline output for estimated power in red and of the built-in current sensor in blue. The output is for a test run that had median end-to-end energy error out of the 60 test runs. This test run was a navigation test of Google Calendar app in Dark Mode.
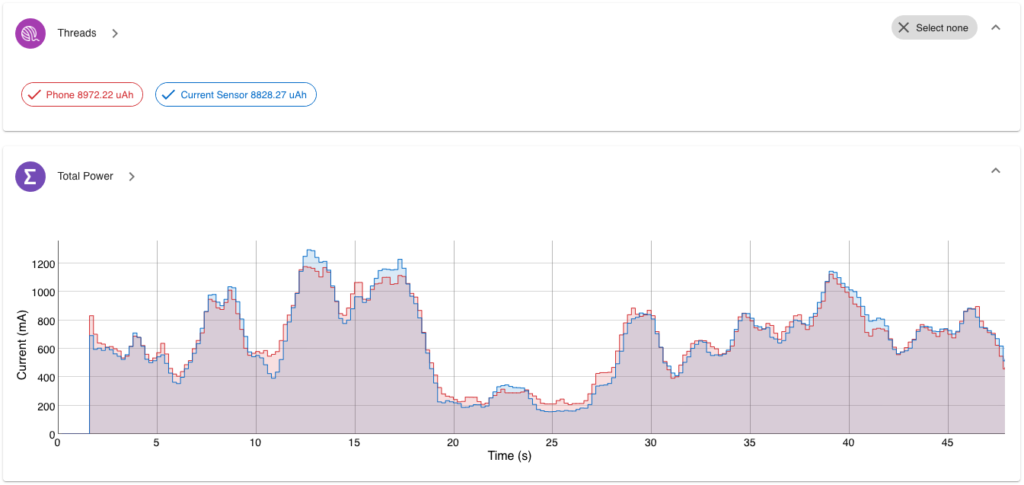
Figure 9 shows the histogram of absolute power estimation error in 2-second windows for this test run. Roughly 50% (or 117) out of 233 2-second windows have an absolute power error of less than 6% as shown by the first bar in the histogram. This shows that the instantaneous power estimations by Eagle Tester are very close to the ground truth power draw measured by the built-in current sensor.

Overhead
To quantify the logging overhead, we leverage Eagle Tester’s fine-grained energy accounting to separate energy consumed by Eagle Tester from the energy consumed by the apps under test. Note that the ground truth for such separation can not be measured by the built-in current sensor since the sensor only records total phone power consumption.
Figure 10 shows the histogram of logging overhead measured as the average power consumed by Eagle Tester during the 60 test runs. We see that Eagle Tester consumes a maximum of 288.2 mA average power. And for over 50% of test runs (31 out of 60), Eagle Tester consumes less than 96.2 mA average power.
For heavier app workloads, Eagle Tester consume higher power. For example, all 9 traces in the last bucket (224.2, 288.2] were from the test runs playing video on YouTube. Even for these test runs, we did not visually see any change in YouTube video playback behavior such as delays due to buffering video or jittery video playback. We thus conclude that such overhead for in-lab battery drain testing is sufficiently low as it does not alter perceivable app behavior.

Takeaways
Estimating power accurately using the modeling-based approach requires overcoming several technical challenges. These include choosing comprehensive power triggers which can be logged with minimal overhead, isolating power consumption of individual phone component and choosing the right model type. At Mobile Enerlytics, we have developed effective solutions to all the challenges mentioned above which culminated in our energy profiling tool Eagle Tester.
We evaluated the accuracy of Eagle Tester over 60 test runs and found end-to-end energy drain error to be less than 6.5%. We further found median instantaneous power draw estimation errors to be less than 6%. We also evaluated the overhead of Eagle Tester and found it to be sufficiently low for an in-lab battery drain testing solution.
There is more to battery drain testing than accuracy. We will continue our four-part blog series on battery drain testing by next writing about how Eagle Tester achieves high repeatability in Part III. Stay tuned!
Is accurate battery drain testing important to you? What battery drain testing solution are you currently using and how accurate is it? We would love to hear your thoughts in the comments below. We also invite you to give Eagle Tester a try!
