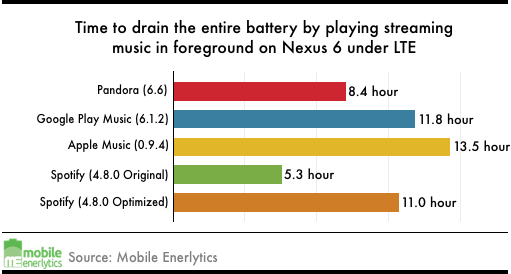
Our battery-drain testing shown in Figure 1 of our previous blog revealed that in foreground music playback, Spotify performs far worse than all of its competitors, draining battery at alarming 55% and 23% faster than Apple Music and Google Play Music, respectively.
Now imagine that I am a developer of the Spotify app and am familiar and comfortable with all the major modules of the app developed over the years, and was shocked to see the gap. How do I go about figuring out the reason for the huge gap in order to eliminate the culprit and make Spotify battery drain come close to Apple Music?
It turns out from talking to developers we learned this is something many app developers have been trying to do — to figure out why is my app draining more battery than a competing app or than my app’s previous release two weeks ago.
To facilitate this task, we introduced the Energy Diffing feature to Eagle which allows instant, head-to-head comparison of battery usage of two apps at the source-code level. The intended usage, of course, is for competitive analysis of similar apps, e.g. Spotify and Apple Music, or different releases of the same app.
Eagle— source-code-level battery drain comparison
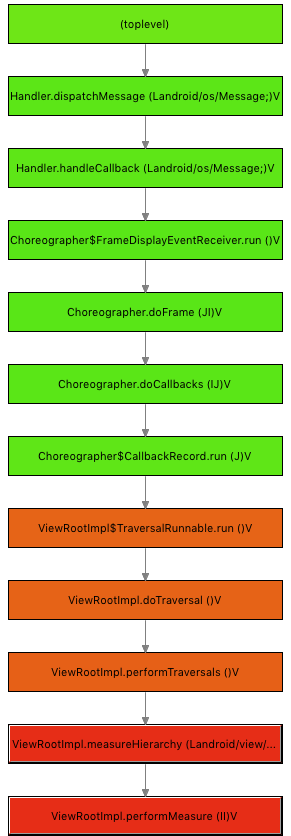
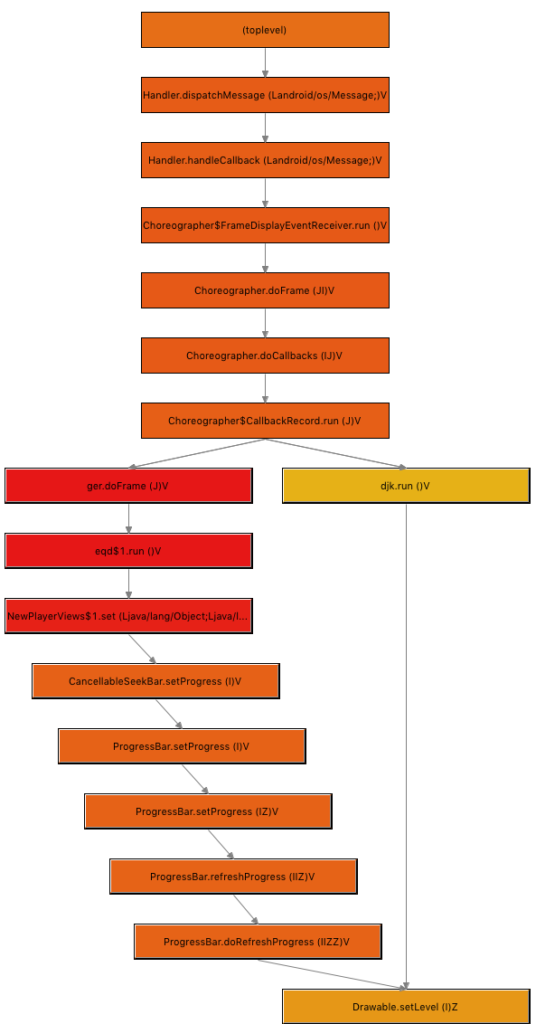
Eagle gives source-code-level insights into why one app execution consumed more energy than the other. The diffing is unidirectional: when we invoke DiffView on Eagle trace A against trace B [trace A — trace B], the output shows a table listing all the methods in trace A along with their corresponding difference in energy consumption and in the number of calls (between the two traces). The tabular view is accompanied by a call graph view (like in Figure 3) of trace A, where each method node’s color indicates the energy difference in the two traces; the redder the node, the more energy drain the method in trace A over in trace B.
Finding UI energy inefficiency in Spotify
Since we have a fairly efficient reference app at hand, Apple Music, we can analyze the energy inefficiency of Spotify by simply invoking Eagle on [Spotify — Apple Music], for the contested usage scenario, i.e., foreground music playback.
I ran the apps on Nexus 6 phone under LTE. During the experiment, both apps are on their respective player activities playing music for 1 minute each without any user interaction — as shown in Figure 2.
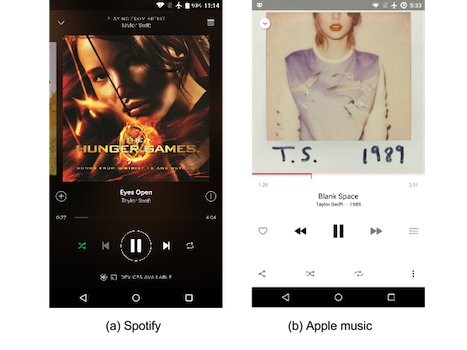
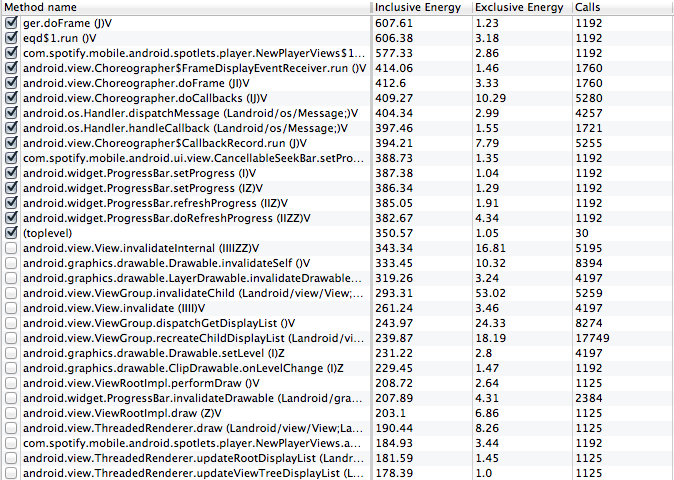
Table 1 shows the diffview’s table view output and figure 3 shows a pruned call graph after diffing [Spotify — Apple Music]. We immediately see here that the path containing “ProgressBar.setProgress()” brings most of the energy difference. Referring back to the table view, I found that the progress bar was actually set 1192 times more in Spotify compared to Apple music in the 1-minute play — Spotify updates the progress bar 21 times per second, while Apple music only updates progress bar once per second.
Such high frequency update is completely unnecessary if you do the simple math. A typical phone screen has 1024 pixels horizontally. A 4-minute song will advance the progress bar by roughly 4 pixels per second. In other words, in Spotify, four out of five consecutive updates do not even move the progress bar by a single pixel.
I reduced this update frequency to update every 200 ms (moving the progress bar by 1 pixel) by modifying and recompiling the apk. This does not bring any noticeable change in the UI, but extends the battery life from 5.3 hours to 11 hours as shown in Figure 1.
PS: Out of curiosity, I also diffed [Apple music — Spotify] using DiffView which outputs the annotated call graph shown in Figure 4. The root method node is green signifying that overall Apple music consumed less energy than Spotify, but still there are red nodes present in the layout hierarchy measurement. This is due to the parameter misconfiguration bug discussed in our previous blog which is not present in the Spotify app.
It is fascinating to see Eagle can also uncover energy inefficiencies of a more efficient app when comparing it to a less efficient app !